How dID the Real Estate Market look in October 2021?
Your concise guide to the trends, Burlington Ontario.
Another month of 2021 has raced by! Here are the market trends for Real Estate in the Burlington, Ontario housing market. Your concise guide to the trends.
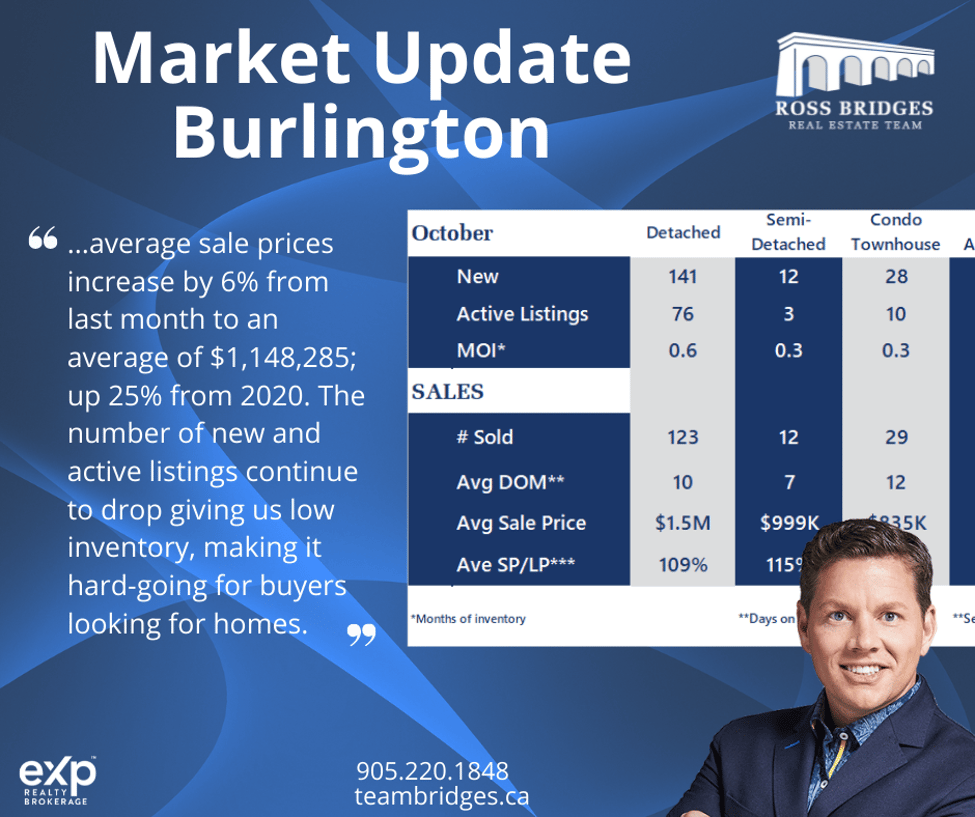
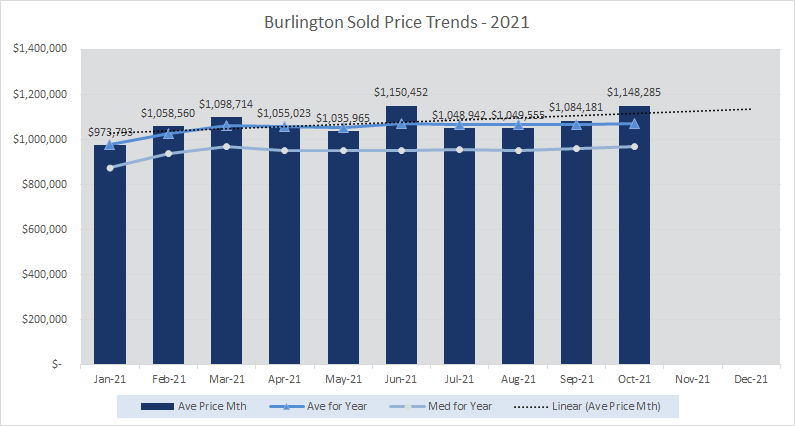
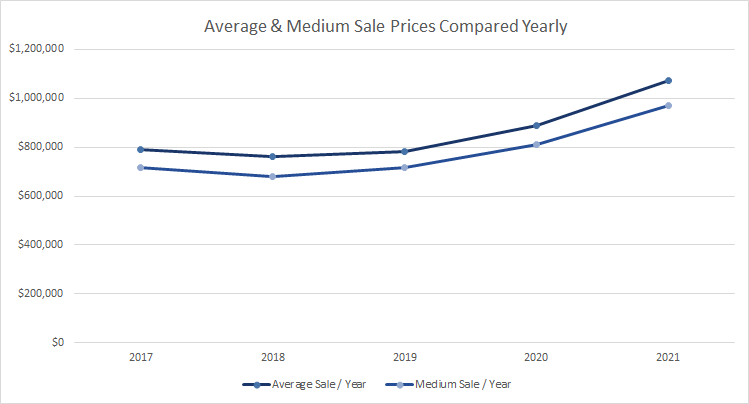
 October saw the Burlington average sale prices increase by 6% from last month to an average of $1,148,285; up 25% from 2020. The number of new and active listings continue to drop giving us low inventory, making it hard-going for buyers looking for homes. Get in touch with us today and see how signing up for listings as they come onto the market can give you an edge, and speak to us about the best strategies for home purchasing, so that you are ready to go once you have found the right home.
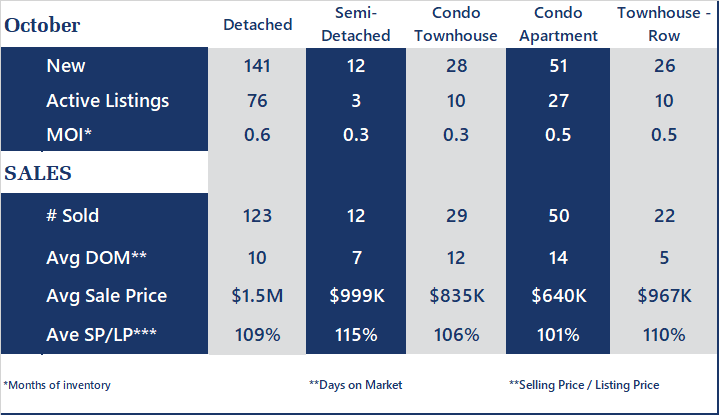
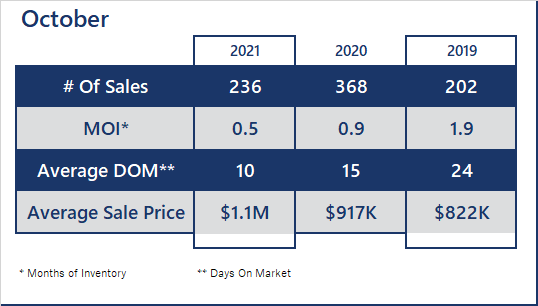
The number of sales were down, both from last month and 2020, to 238. Those properties that are for sale are spending an average of 10 days on the market (DOM). This is very low, not quite the lowest which was 9 days back in April, highlighting again the importance of being ready if you are looking to buy.
 Average sale price to list price is up again at 108% (meaning that properties are selling, on average, 8% higher than the asking price). As we know, like many cities and towns, Burlington has many different types of homes and neighbourhoods which all vary in their trends of average prices and activities. This is why it is very important to talk to us now if you are planning a move and get the specifics on the areas that you are thinking of. Which types of homes sell best? On average, Detached properties sold for 109%, in comparison to Condo Apartments at 101%. Although Semi-detached sold on average 115%, as a smaller number of sales, 1 or 2 large ones can easily skew the numbers. Hence, it is important to speak to us and get an understanding of the market and a good strategy for buying and selling your home. Contact us now, we are here to help and love to talk real estate!
Months of inventory (MOI) is always a good metric to look at for general view of the current market. This has been low for the past couple of years, in 2019 a 2.0 average, in 2020 a 1.4 average, and now in 2021 we are very low at 0.6 average, 0.5 for October. This suggests a very strong Seller's Market.
Average sale price to list price is up again at 108% (meaning that properties are selling, on average, 8% higher than the asking price). As we know, like many cities and towns, Burlington has many different types of homes and neighbourhoods which all vary in their trends of average prices and activities. This is why it is very important to talk to us now if you are planning a move and get the specifics on the areas that you are thinking of. Which types of homes sell best? On average, Detached properties sold for 109%, in comparison to Condo Apartments at 101%. Although Semi-detached sold on average 115%, as a smaller number of sales, 1 or 2 large ones can easily skew the numbers. Hence, it is important to speak to us and get an understanding of the market and a good strategy for buying and selling your home. Contact us now, we are here to help and love to talk real estate!Months of inventory (MOI) is always a good metric to look at for general view of the current market. This has been low for the past couple of years, in 2019 a 2.0 average, in 2020 a 1.4 average, and now in 2021 we are very low at 0.6 average, 0.5 for October. This suggests a very strong Seller's Market.
ROSS BRIDGES REAL ESTATE TEAM - HELPING YOU FIND YOUR WAY HOME!
How does this month compare to last? Read the Burlington September Market Update.
How does Oakville compare to Burlington? Read the Oakville October Market Update.
Dit you know that Ross has a Podcast? Check out Rambling REALTORS® for discussions about all things Real Estate, including trends and statistics!
Call us now! Or schedule a phone or Zoom consultation with Ross Bridges, REALTOR® - Helping you find your way home.
We will never sell your information - View our Privacy Policy now.