How does the Real Estate Market look in November 2021?
Your concise guide to the trends, Burlington Ontario.
As we head to the end of another year, it seems our hope that the pandemic would be a distant memory by now is not going to be the case. Let’s have a look how the real estate market trends for Burlington, Ontario are fairing in these unique times! Here is your concise guide to the trends…
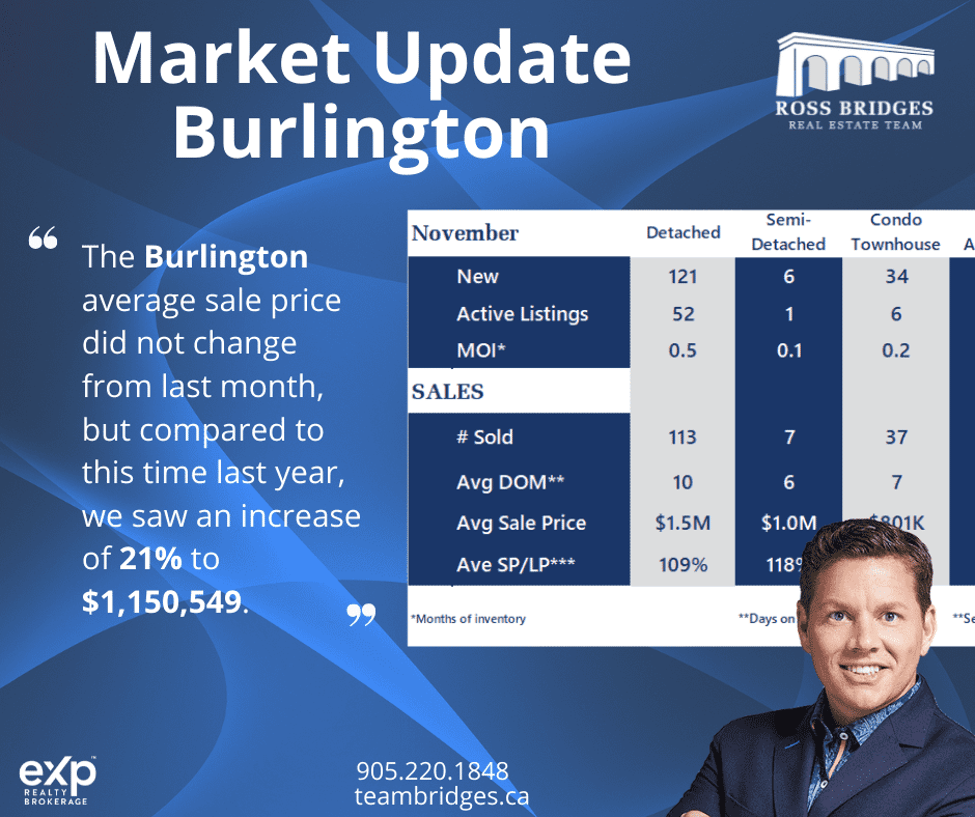
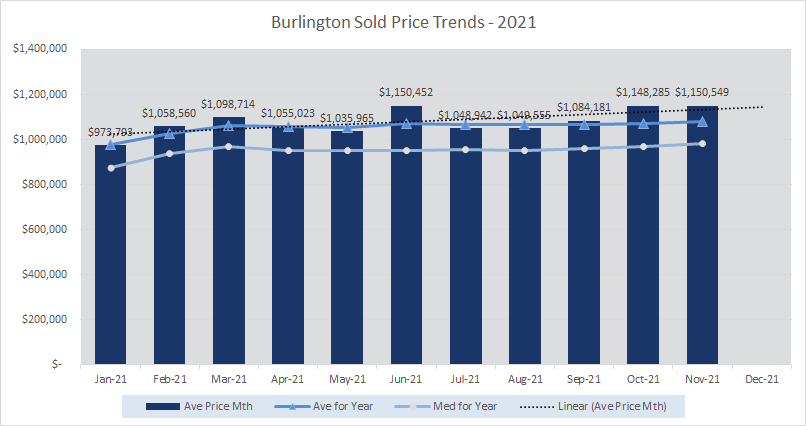
 We will start with the average sale price, always a hot topic! The Burlington average sale price did not change from last month, but compared to this time last year, we saw an increase of 21% to $1,150,549. Numbers of new and active listings continue their trend downwards, with 9% less new homes coming to the market and 27% less active listings, than last month. Inventory is 63% lower than this time last year, continuing to make it a challenging market for buyers. Please contact us now and see how signing up for listings as they come onto the market can give you an edge and speak to us about the best strategy for home purchase so that you are ready to go once you have found the right home.
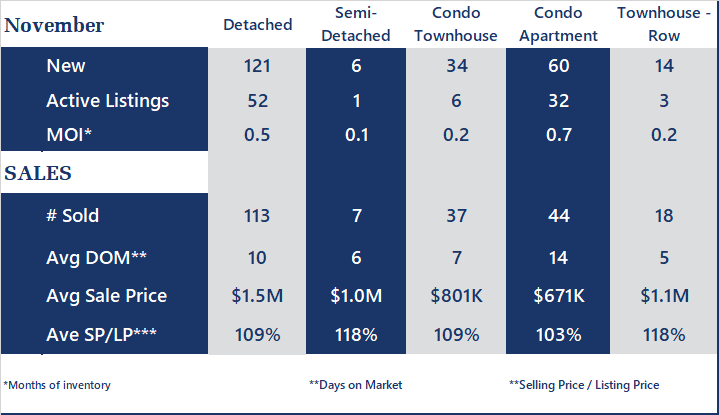
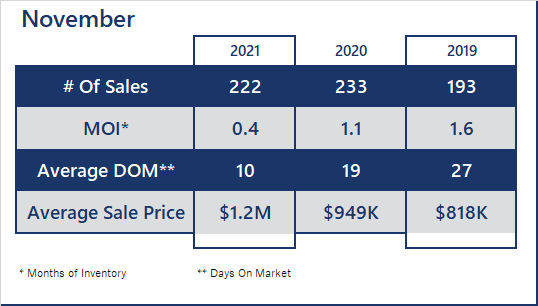
Sales are down both from last month (6%) and 2020 (4%). With low inventory, this is not surprising, and average days on market remains low at 10 days and months of inventory is at its lowest at 0.4. This low inventory continues to push the average sale price up and we are 0.8% higher than last month and 22% than this time last year.
 Average sale price to list price raised from 108% last month to 110% this month. Like many cities and towns, Burlington has many different types of homes and varied neighbourhoods that create ‘micro’ markets with their own trends; it is very important to talk to us now if you are planning a move and get the specifics on the areas that you are thinking of.
 Which types of homes sell best? If you look at the chart, you will see we compare the most common types of homes and, as normal, the detached homes are more dominant in this area with an average sale price of $1.5 million, the next are the condo apartments at $671 thousand. A very big difference, but a reminder that you need all the facts as just one or two factors can skew the numbers. Talk to us now at 905-220-1848 and let us get all the information for the area and type of home you are looking to sell or buy, or email [email protected]. We love to talk Real Estate!
ROSS BRIDGES REAL ESTATE TEAM - HELPING YOU FIND YOUR WAY HOME!
Burlington and Oakville are right next door to each other, but how do they compare? Read the Oakville November Market Update.
See the numbers for Burlington October 2021 here.
Did you know that Ross has a Podcast? Check out Rambling REALTORS® for discussions about all things Real Estate, including trends and statistics!
Call us now! Or schedule a phone or Zoom consultation with Ross Bridges, REALTOR® - Helping you find your way home.
We will never sell your information - View our Privacy Policy now.